Plan / Weather and climate
Weather is part
of the itinerary
Wuhan is a humid subtropical river city with four real seasons, two of them difficult. The numbers below are climate normals, not a forecast — they exist to help you choose dates and plan a day, not to tell you what to wear next Tuesday.
Late October and November are the most comfortable months; July and August are genuinely hot and humid, and June brings the plum rains. Winter is cold and damp but the city does not shut down. Official 1991–2020 normals put the annual mean at 17.4 °C, annual rainfall at about 1,310 mm, and average relative humidity at 76%. Check a live forecast for your actual dates before you fly.
The most useful thing to know about Wuhan's weather is not the temperature. It is that humidity sits at both ends of the year: summer is hot and wet, winter is cold and damp in a way a light coat does not stop, and June adds persistent rain to an already busy travel month. This page gives the verified monthly figures, then translates them into decisions. When to visit handles dates, holidays and blossom season; this page handles the weather itself.
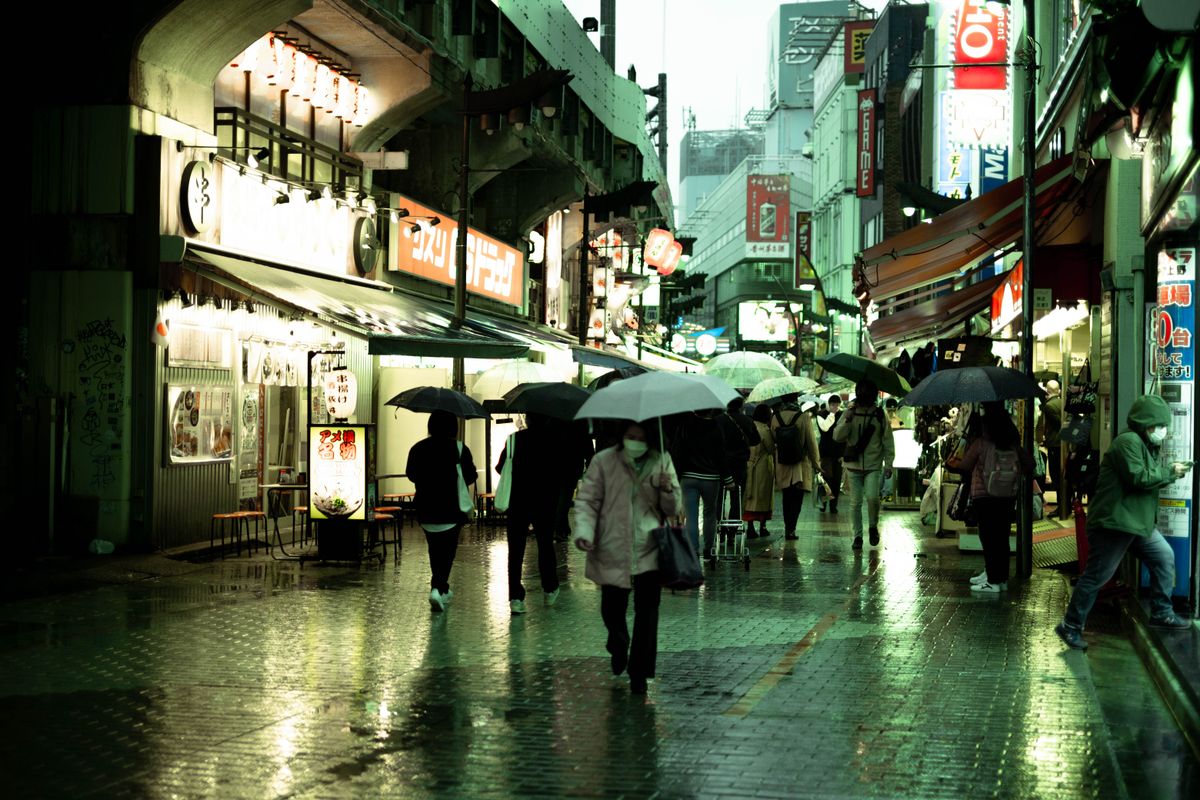
Four seasons, in plain language
| Season | Feel | What changes | The call |
|---|---|---|---|
| Mar–Apr | Mild, changeable, wetter each month (11.6 °C to 17.8 °C mean) | Blossom crowds and campus reservation rules; rain in April | Best scenery, most complicated logistics |
| May–Aug | Warming to very hot; June is the wettest month by rain days, July by rainfall | Outdoor time moves before 9 a.m. and after sunset; museums at midday | Come with a plan, not a walking itinerary |
| Sep–Nov | Heat breaks, then clear and mild (24.3 °C down to 12.0 °C mean) | National Day week is the exception: the best weather and the biggest crowds | The safest all-round window |
| Dec–Feb | Cold, damp, grey; mean 4.1–7.0 °C, short daylight | Fewer outdoor hours, more museums and food streets | Quiet and workable, not a dead city |
Seasonal means are the monthly normals in the table below, rounded to one decimal (F86). Crowd and logistics judgements are editorial, not climate data.
Month by month: the official normals
These are 1991–2020 climate normals for the Wuhan station, published by the China Meteorological Administration — a thirty-year average, not a prediction. We use one internally consistent dataset rather than mixing sources: it is the only one we found with all twelve months of temperature, rainfall, rain days and humidity on the same basis. The source also publishes sunshine, but other websites count it differently, so that column is left out (see the note below the table).
| Month | Avg high °C | Avg low °C | Rain mm | Wet days | Humidity |
|---|---|---|---|---|---|
| January | 8.3 | 1.0 | 52.5 | 9.7 | 76% |
| February | 11.4 | 3.6 | 66.4 | 9.9 | 76% |
| March | 16.3 | 7.9 | 91.0 | 12.6 | 75% |
| April | 22.7 | 13.7 | 137.5 | 11.6 | 74% |
| May | 27.3 | 18.8 | 160.6 | 12.5 | 74% |
| June | 30.4 | 23.0 | 212.9 | 12.0 | 78% |
| July | 33.2 | 26.2 | 255.5 | 11.1 | 76% |
| August | 32.8 | 25.4 | 106.3 | 9.7 | 77% |
| September | 28.9 | 20.8 | 72.2 | 7.7 | 75% |
| October | 23.3 | 14.8 | 66.4 | 8.5 | 76% |
| November | 17.1 | 8.4 | 58.2 | 9.1 | 77% |
| December | 10.8 | 2.8 | 30.7 | 7.2 | 74% |
| Year | 21.9 | 13.9 | 1,310.2 | 121.6 | 76% |
Wet days count days with at least 0.1 mm of precipitation; the threshold matters, because other published tables use different ones and give much smaller monthly counts. Sunshine is deliberately omitted here: some sources publish daily sunshine hours and others monthly totals, and the two are not interchangeable. Annual mean temperature is 17.4 °C; the station's average date of winter onset is around 24 November. We cross-checked the January, September and November values against the Wuhan Meteorological Service's own monthly climate bulletins, which quote the same 1991–2020 station normals (52.5 mm, 72.2 mm, 58.2 mm respectively).
Even official documents do not agree to the decimal. For November, the Wuhan Meteorological Service's monthly bulletin gives a long-term mean of 12.2 °C and 58.2 mm in its text but 56.2 mm in a bracketed station normal; the CMA table above says 12.0 °C and 58.2 mm, a gridded climate site says 12.6 °C, and the older 1981–2010 normals say 11.9 °C. Annual rainfall is variously published as 1,269 mm, 1,310.2 mm, an official range of 1,228–1,389 mm, and about 1,485 mm from a model. We do not pick a winner. Treat the table as a planning baseline, not a precise measurement, and never quote a monthly figure as a forecast (F87).
What the numbers do not tell you
The "furnace" label is folklore, not a ranking
Wuhan, Chongqing and Nanjing have been called China's "three furnaces" since the 1920s–30s. The China Meteorological Administration says plainly that the original label had no meteorological data behind it and was a folk saying, and the national climate centre has published two different heat rankings with Wuhan in different positions. What is not in dispute is the felt experience: July averages 33.2 °C by day and 26.2 °C at night, at 76% humidity. Read the CMA explainer
Folk label · F88aJune is the plum-rain month
Meiyu (plum rain) typically runs from mid-June to early or mid-July, roughly 20–30 days, with persistent rain rather than all-day downpours. National guidance describes 200–400 mm across a season; local meteorological archives give average onset dates of 15 or 17 June depending on the dataset, so we do not publish a single date. June's 212.9 mm and 78% humidity in the table are the planning reality. CMA on plum rains
Wet, not dramatic · F88bWinter cold goes through a light coat
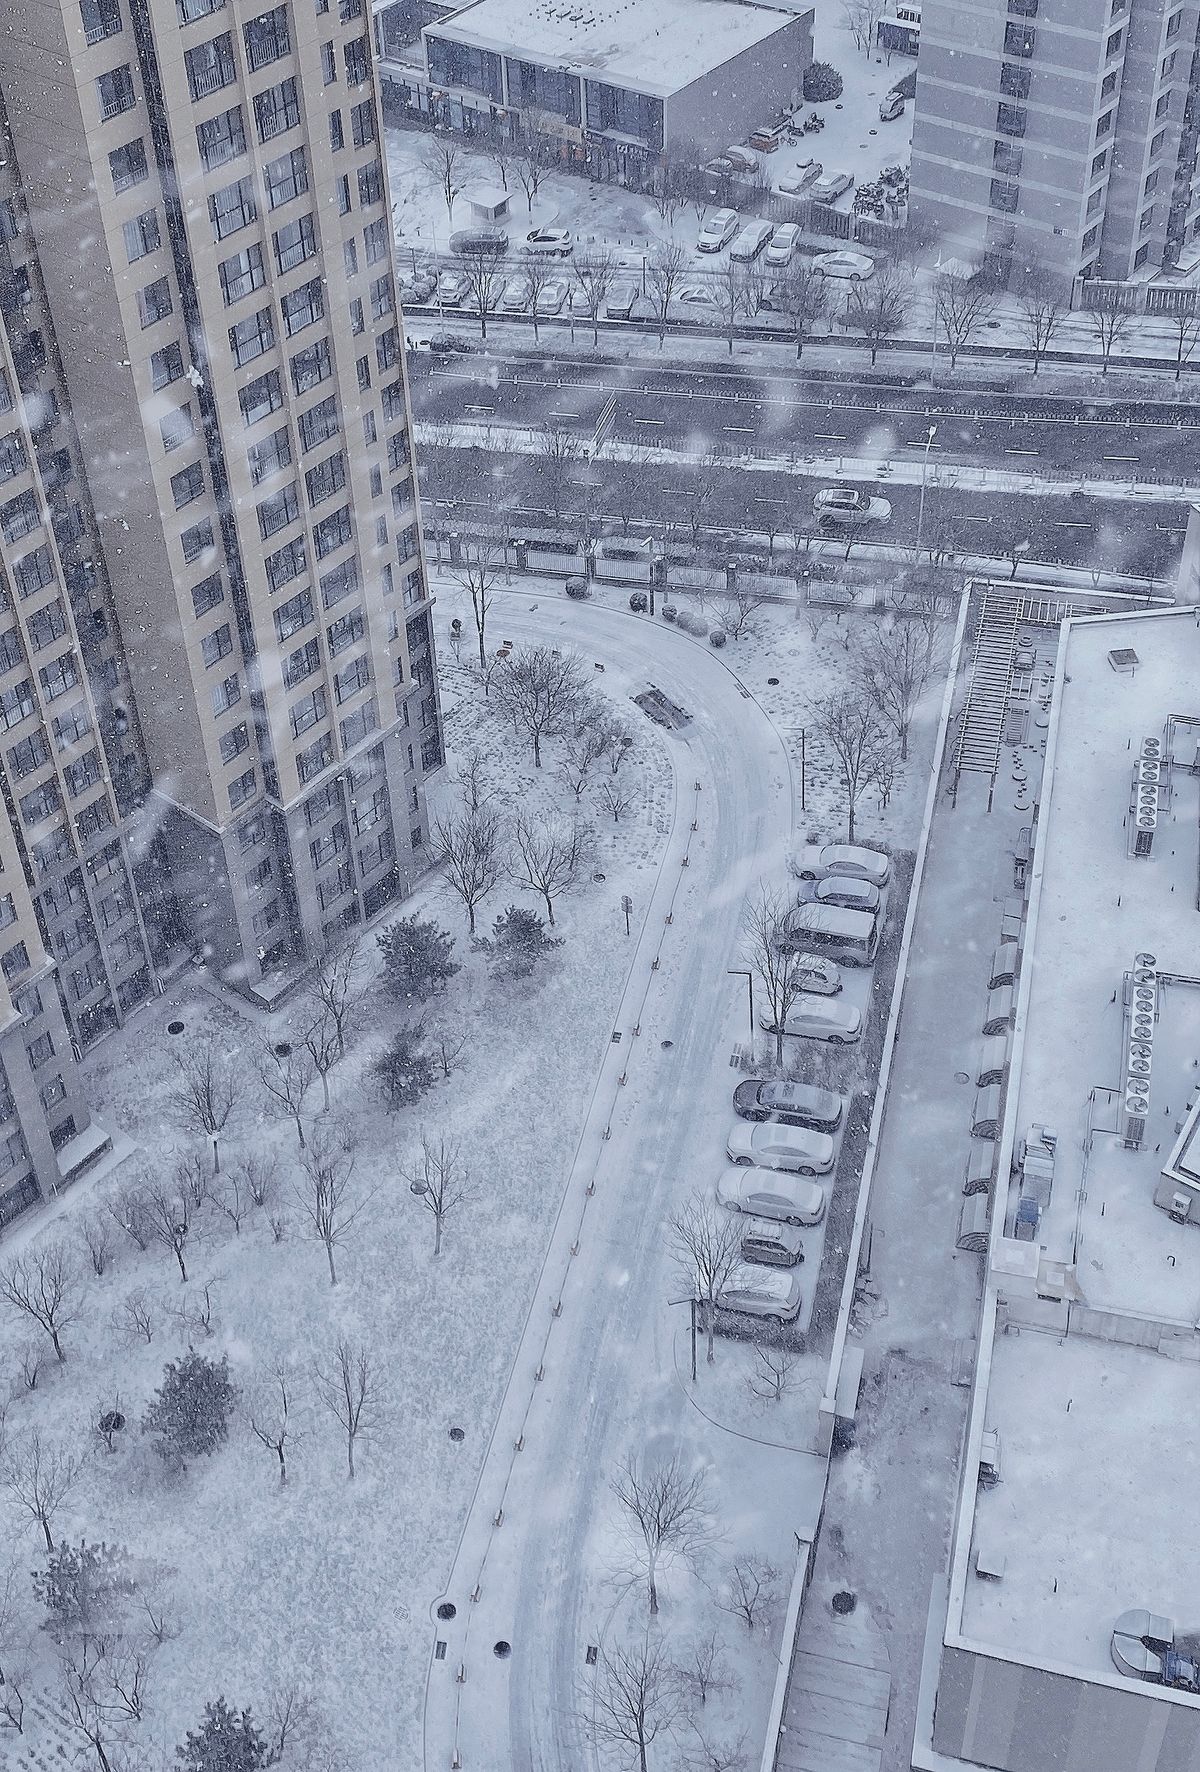
January's mean low is 1.0 °C and humidity stays around three-quarters. The cold is damp, indoor heating is less universal than visitors from northern Europe or North America expect, and short daylight cuts the outdoor day. Snow is possible — the station averages 9.4 snow days a year — but slush and grey skies are more typical than a snowy postcard.
Layers, not one coatThe records, with their caveats
The official record low is −18.1 °C (30 January 1977), consistent across four sources. The record high has two incompatible versions: 41.3 °C on 10 August 1934 in historical observations that predate the modern record, and 39.7 °C on 27 July 2017 in the CMA's 1951-to-present series. We quote both with their basis rather than a single dramatic number (F88c).
Two records, two scopes
Weather changes the plan
Summer: restructure the day
Indoor museums at midday, outdoor time before 9 a.m. and after sunset, a hotel with working air conditioning near a metro station. If your only dates are July or August, rebuild the route around short hops rather than cutting things out after you arrive.
Not just discomfortRain: one indoor block per outdoor block
River ferries, the lake greenway and bridge walks lose their appeal in persistent rain; the museum and old-street options do not. The Bridge Museum is a weather-proof alternative if you confirm its opening first.
June and AprilRiver views need visibility
Haze, heavy rain and low cloud flatten exactly the views people come for: the tower from the bridge, the skyline from the ferry, the lake from the greenway. Keep the river crossing as a moveable part of the day, not a fixed photo appointment.
Moveable, not cancelledBlossom dates move with the weather
Flowering is temperature-driven and shifts year to year. Use a current flowering forecast and check campus access rules rather than a fixed calendar date — see the blossom guide.
Season, not dateBefore you fly: check these, not us
This is a static handbook. We publish a dated climate baseline, never live weather, and we will not pretend a number is current. For the actual days of your trip use an official forecast, and for warnings use the national meteorological centre:
Official Chinese forecasts
China Weather Network — Wuhan 7-day · CMA city forecast, station 57494 · National Meteorological Center — Wuhan and warning signals · Climate background for Wuhan
Some mainland sites load slowly from abroadEnglish-language option
meteoblue Wuhan forecast in English. We link it but do not reproduce its climate charts: that data is published under a non-commercial licence.
Forecast onlyA thirty-year normal describes a typical year, not yours. A heatwave, a late plum-rain season or an early cold front will ignore this table completely. The figures are also station normals for one site in a very large city: riverside, lake-side and dense urban blocks can feel different on the same afternoon. Check a forecast three days out, keep one indoor alternative per day, and treat everything above as background for choosing dates, not a weather report.
What to pack
Layers and a water-resistant outer layer rather than one heavy coat, shoes you have already broken in, a compact umbrella in June, and a power bank. The packing section of When to visit has the full list, including the non-clothing items that matter more — passport, a Chinese-character hotel address, offline translation, and a working payment app before you land.

Questions we keep seeing
What is the weather like in Wuhan in July?
Does it snow in Wuhan?
When is the rainy season in Wuhan?
Is Wuhan really one of China's 'three furnaces'?
What are the record temperatures in Wuhan?
Where should I check the forecast before travelling?
Sources, prices and currency
All monthly and annual climate figures on this page come from FACTS F86: the China Meteorological Administration 1991–2020 normals for Wuhan station (24 m), as transcribed in the English Wikipedia climate table and cross-checked against four independent mirrors because the primary page was unreachable from our build network. The January / September / November values were independently cross-checked against Wuhan Meteorological Service monthly climate bulletins quoting the same station normals. Conflicts, differing sunshine and rain-day definitions, gridded-model datasets and single-year observations are recorded as F87 and summarised in the callout above; no single disputed value is presented as authoritative. The 'three furnaces' framing, plum-rain window, record temperatures, winter-onset date, frost-free period and climate classification follow F88 with the sources named there. Official climate background and municipal ranges: Wuhan municipal government city profile. Forecast and warning links are F89 and are managed in data/reference-links.json; they are links only, never republished data. All four photographs are from Pexels, listed in data/image-credits.json; the snow photograph is Beijing and is labelled as such. Class B: re-check the links and the source note quarterly; the climate normals themselves are long-period background (Class C). See the source method.
Every CNY amount on this page is shown twice: the yuan figure you will actually see on the price board, and a US dollar conversion for budgeting. Dollar values are mid-market conversions at 1 CNY = $0.14957 (ExchangeRate-API (open.er-api.com), 12 Nov 2026), refreshed automatically when the page loads and cached for 24 hours. Your bank or card issuer will use its own rate and may add a foreign-transaction fee. Full explanation.
Checked quarterly — hours, routes and venues. This page was last checked 2026-11.